Professor Dr. med. Christian ScharfetterDept. of Psychiatry, Psychotherapy & PsychosomaticsPsychiatric Hospital, University of Zurich |
|

|
Vulnerability to AsthmaUsing the genome-wide screening data of the CSGA (226 families, 1'461 genotyped subjects, 323 marker loci) and Hutterite studies (129 families, 690 genotyped subjects, 365 marker loci) we applied a genetic similarity function in order to quantify the inter-individual genetic distances d(Xi,Xj) between feature vectors Xi, Xj made up by the allelic patterns of subjects i, j with respect to loci L1, L2,.. Ln. Based on this similarity function, we structurally decomposed the genetic diversity of the CSGA population in order to address the question of ethnicity-related asthma vulnerability for genetically homogenous CSGA subgroups. The question of ethnicity-independent asthma vulnerability was investigated with all CSGA families as training and the Hutterite families as replication samples. Oligogenic Models with InteractionsWe evaluated the between-sib similarities which were expected to deviate from "0.5" in affected sib pairs if the region of interest contained markers close to disease-causing genes. The reference value "0.5" was derived by determining the parents-offspring similarities which are always "0.5", irrespective of the affection status of parents and offspring. We found 18 vulnerability loci on chromosomes 1, 3, 4, 5, 6, 8, 12, 13 and 14, which were remarkably reproducible in the CSGA and the Hutterite data and constituted an ethnicity-independent oligogenic model. Ethnicity-Independent VulnerabilityTreating the genome as a single entity we subdivided the genetic map, implicitly defined by the M marker loci, into m segments Si each including 10 markers (i=1,2,.. m). Each segment Si was then systematically combined with each segment Sj into a feature vector of length 20 (i≠j), thus enabling the detection of interactions between any two loci. Based on the 20-dimensional feature vectors and a set-theoretical similarity function we determined the distribution of parent-offspring similarities, the distribution of between-sib similarities of affected sib pairs, and the distribution of between-sib similarities of unaffected sib pairs. Subsequently, the signal detection algorithm looked for significant differences between the parent-offspring similarities and the between-sib similarities of affected sib pairs under the constraint that no such differences showed up between the parent-offspring similarities and the between-sib similarities of unaffected sib pairs. Those loci that contributed significantly to deviations in the expected values of genetic similarity constituted an oligogenic model. References
Stassen HH, Begleiter H, Porjesz B, Rice J, Scharfetter C, Reich T: Structural decomposition of
genetic diversity in families with alcohol dependence. Genetic Analysis Workshop 11: Analysis
of genetic and environmental factors in common diseases. Genetic Epidemiology 1999; 17:
325-330
Stassen HH and Scharfetter C: Integration of genetic maps by polynomial transformations.
Am J Med Genetics B 2000; 96: 108-113
Stassen HH, Bridler R, Hägele S, Hergersberg M, Mehmann B, Schinzel A, Weisbrod M, Scharfetter C:
Schizophrenia and smoking: evidence for a common neurobiological basis?
Am J Med Genetics B 2000; 96: 173-177
Hoffmann K, Stassen HH, Reis A: Genkartierung in Isolatpopulationen. Medizinische Genetik 2000;
12,4: 428-437
Stassen HH, Scharfetter C: Oligogenic approaches to the predisposition of asthma in ethnically
diverse populations. Genetic Analysis Workshop 12: Analysis of genetic and environmental factors
in common diseases. Genetic Epidemiology 2001; 21(1): 284-289
Stassen HH, Hoffmann K, Scharfetter C: Similarity by state/descent and genetic vector spaces:
Analysis of a longitudinal family study. Genetic Analysis Workshop 13: Analysis of longitudinal
family data for complex diseases and related risk factors. BMC Genet 2003; 4, S59: 1-6
Stassen HH, Bridler R, Hell D, Weisbrod M, Scharfetter C: Ethnicity-independent genetic basis
of functional psychoses. A Genotype-to-phenotype approach. Am J Med Genetics B 2004; 124:
101-112
Berger M, Stassen HH, Köhler K, Krane V, Mönks D, Wanner C, Hoffmann K, Hoffmann MM, Zimmer M,
Bickeböller H, Lindner TH: Hidden population substructures in an apparently homogeneous
population bias association studies. Eur J Hum Genetics 2006; 14: 236-244
Stassen HH, Szegedi A, Scharfetter C: Modeling Activation of Inflammatory Response System.
A Molecular-Genetic Neural Network Analysis. BMC Proceedings 2007, 1 (Suppl 1): S61, 1-6
Stassen HH, Hoffmann K, Scharfetter C: The Difficulties of Reproducing Conventionally Derived
Results through 500k-Chip Technology. BMC Genet Proc. 2009; 3 Suppl 7: S66
|
|
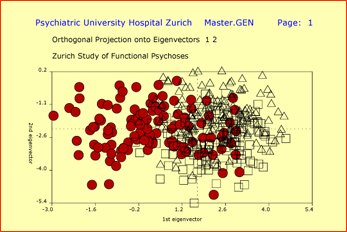
Genetic vector space spanned by 20 polymorphic markers on chromosomes 6, 11 and 22 reveals differences between ethnic groups: circles designate Afro Americans (n=141), triangles NonAfro Americans (n=111), and squares Swiss subjects (n=257). Subjects are projected onto the hyperplane defined through the eigenvectors associated with the 2 largest eigenvalues.
Please note: population stratification can be a critically important issue in genetic studies.
For example, adverse side effects under drug treatment, the
inter-individual variation in dose, blood-level, and weight gain, are ethnicity-specific.
|
|
| [ Mail to Webmaster ] k454910@ifrg.ch |
|